 VECTOR STUDIOS
LLM monitoring: 3 signals ML teams must track with OpenTelemetry
LLM monitoring is the practice of tracking an LLM application’s operational health and behavioural stability once it is live, and the three signals to instrument first are behavioural stability, output quality, and core operational health. Start with OpenTelemetry’s GenAI semantic conventions as your tracing baseline rather than inventing a bespoke schema.
-
Behavioral signals like fingerprinting, flip rate, and distributional drift are essential to detect silent changes and shifts in model behavior that operational metrics miss.
-
Operational metrics such as latency, throughput, and error rate must be supplemented with behavioral and infrastructure signals to provide a complete health picture for production LLMs.
-
Adopting OpenTelemetry’s GenAI semantic conventions for traces ensures vendor-neutral, readable, and portable telemetry that supports consistent monitoring across different providers.
-
Baselines for fingerprinting and flip rate must be reset after each model update or retraining to accurately detect regressions and avoid false positives.
-
Combining trace-based telemetry, scheduled evaluation, and alerting disciplines creates an effective feedback loop for early detection and incident response of LLM deployment issues.
Vector Studios helps teams develop and integrate custom AI solutions, with full orchestration, integration and ongoing support.
Explore AI Solutions →Table of Contents
-
Building the monitoring pipeline: ingest, evaluate, feedback
-
Fitting LLM monitoring into existing ML Ops and DevOps workflows
-
Why model updates and retraining change your monitoring baseline
-
Security and privacy considerations when monitoring LLM outputs
What LLM monitoring and observability actually mean
Monitoring and observability get used interchangeably, which causes real confusion when you’re deciding what to instrument. Monitoring is the set of dashboards and alerts built from predefined metrics: latency, error rate, cost per call. Observability is the broader capability to ask new questions of your system after something has gone wrong, using traces, logs and behavioural data you didn’t necessarily know you’d need.
Traditional APM assumes a service’s correctness is stable between deploys: if latency and error rate look fine, the service is probably fine. That assumption breaks for LLMs. A model endpoint can keep returning 200 status codes with normal latency while silently producing worse, different, or subtly unsafe outputs, because the provider updated a model version, changed a system prompt, or shifted serving infrastructure underneath you. None of that shows up in a standard error-rate graph.
This is why LLM observability has to include behavioural signals alongside the operational ones:
-
Fingerprinting: running a fixed set of probe prompts against the endpoint and comparing the distribution of responses over time.
-
Flip rate: the proportion of previously-stable test cases whose output category changes after an update.
-
Distributional drift: a statistical shift in output embeddings or token distributions relative to a baseline window.
A practitioner note on behavioural fingerprinting makes the point plainly: standard APM signals miss behavioural changes entirely, so teams need to pair operational telemetry with fingerprinting and evaluation loops to catch what latency graphs cannot. Treat behavioural monitoring as a first-class citizen in your observability stack, not an optional add-on bolted on after an incident.
Core metrics to collect for LLM production systems
Every production LLM system needs three tiers of metrics, and skipping any tier leaves a blind spot that tends to surface during an incident rather than before one.
Operational metrics are the baseline you’d expect from any service:
-
Latency: time to first token and total completion time, tracked separately since they fail differently.
-
Throughput: tokens or requests processed per second against your provisioned capacity.
-
Error rate: failed calls, timeouts and retries, broken down by error type.
-
Token usage and cost: input and output tokens per call, aggregated to a per-feature or per-customer cost figure.
Behavioural metrics are where most teams under-invest:
-
Fingerprint distance: a statistical distance (such as energy distance) between current and baseline response embeddings for a fixed probe set, as described in the Stability Monitor fingerprinting method.
-
Flip rate: how often a probe’s categorical output (pass/fail, safe/unsafe) changes between evaluation runs.
-
Perplexity or entropy: a proxy for model confidence, useful for flagging unusual or out-of-distribution inputs.
-
Hallucination score: a composite signal combining internal-state and token-probability features, discussed further below.
Infrastructure signals complete the picture: hardware generation, numerical precision (fp16, bf16, int8), and serving-framework version all affect output behaviour even when the model weights are unchanged.
Energy distance between fingerprint runs can flag a silent endpoint change before a flip rate spike does, according to the Stability Monitor and Stability Arena paper, which positions fingerprinting as a black-box, provider-agnostic early warning signal.
Log all three tiers with consistent timestamps and a shared trace identifier. Without that correlation, you’ll spend an incident correlating three separate dashboards by hand instead of querying one trace.
Instrumenting traces with OpenTelemetry’s GenAI conventions
Vendor-neutral tracing starts with adopting a shared schema rather than a bespoke one your team has to maintain forever. The OpenTelemetry GenAI semantic conventions define standard span attributes for inference, embeddings and retrieval calls, which means your traces stay readable across different model providers and your tooling doesn’t need a custom parser per vendor.
In practice, adopting the conventions means:
-
Create a span per GenAI operation, naming it after the operation (chat, embeddings, tool call) rather than a generic “LLM call” label.
-
Attach standard attributes: model name, provider, token counts and response status, using the convention’s field names so downstream tooling matches without translation.
-
Represent tool calls as child spans nested under the parent inference span, so an orchestration trace shows which tool a model invoked and how long it took.
-
Capture input and output content as opt-in only, since full prompt and completion text often contains sensitive data and bloats trace storage fast.
-
Reference large content externally rather than inclining it: store the full prompt or completion in object storage and attach a reference in the span, a pattern the OpenTelemetry documentation recommends specifically to cut telemetry volume and keep access controls enforceable.
Sampling is the lever that keeps this affordable. Full-fidelity tracing on every call is rarely necessary: sample a representative percentage of traffic at full detail, and fall back to operational-metrics-only for the rest. The trade-off is real: too aggressive a sample rate, and a rare but serious behavioural regression never gets captured in your trace data at all.
Multi-agent orchestration adds a wrinkle here. When one agent’s output becomes another agent’s input, your span hierarchy needs to preserve that chain intact, or you lose the ability to tell which agent in a five-hop chain introduced a bad output.

Detecting behavioural drift and hallucinations
Operational metrics tell you the system is running. They don’t tell you whether it’s telling the truth or behaving consistently, which is why drift and hallucination detection need their own instrumentation layer.
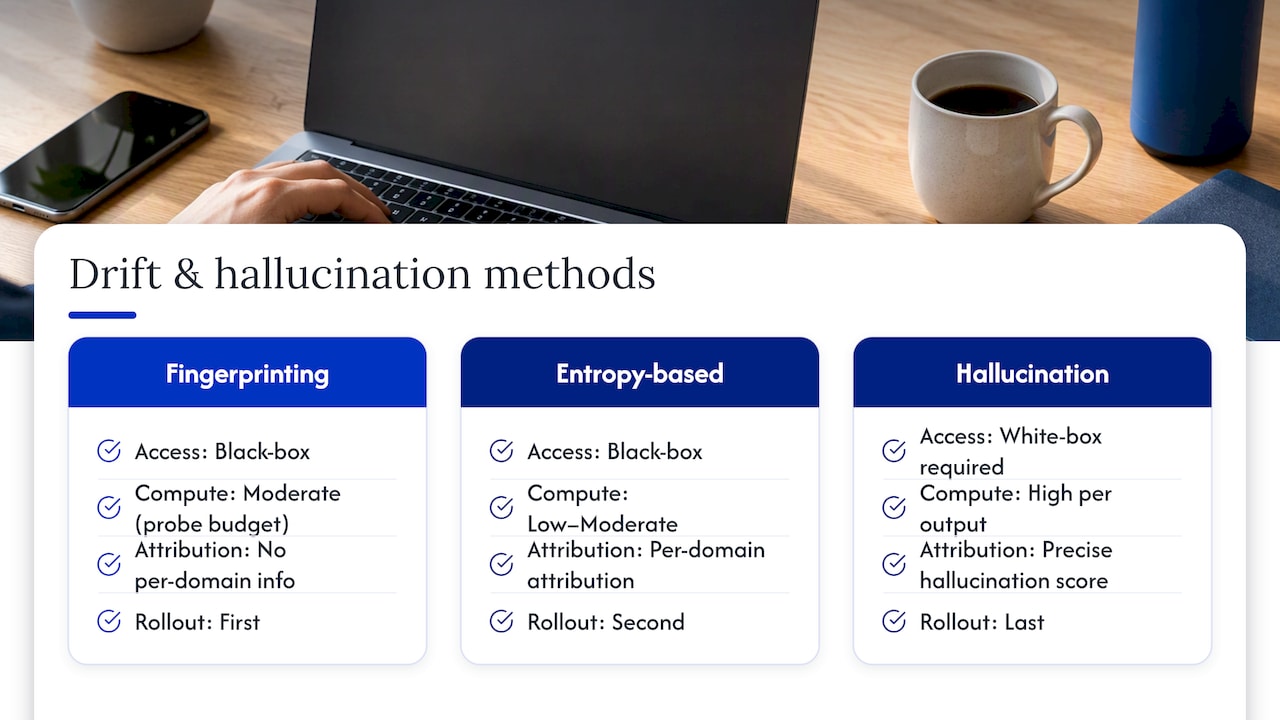
Fingerprinting is the most practical starting point for most teams. The method, as described in the Stability Monitor paper, runs a fixed set of probe prompts against an endpoint on a schedule and compares the resulting response embeddings to a historical baseline using a distance statistic such as energy distance or maximum mean discrepancy. It’s black-box, meaning you don’t need access to model internals, and it works equally well against a third-party API or a self-hosted model. The trade-off is sampling budget: a probe set large enough to catch subtle shifts costs real inference spend run on a regular cadence.
Entropy-based detection adds a dimension fingerprinting alone misses: attribution. KA-LLM’s behavioural drift detection method monitors entropy across multiple per-domain channels simultaneously, which lets a detection event point to which domain or topic area is drifting rather than just flagging that something, somewhere, changed. That per-domain attribution reduces the blind spots that simple embedding-shift detectors leave, since a drift event averaged across all traffic can mask a sharp regression in one narrow domain.
Hallucination scoring is the most compute-intensive of the three. HalluShift-style methods combine internal hidden-state distribution shifts with token-probability features to produce a hallucination score more accurate than heuristic checks like keyword matching or simple confidence thresholds. The catch is access: these methods need internal model signals, meaning white-box instrumentation or a self-hosted model, and they cost more compute per scored output than a black-box fingerprint comparison.
A sensible rollout order for most teams: fingerprinting first, since it requires no internal access and catches the broadest category of silent change; entropy-based attribution second, once you need to localise drift events to a domain; internal-state hallucination scoring last, reserved for the highest-stakes outputs where the compute cost is justified.
Infrastructure drift versus model drift
A model can behave differently for reasons that have nothing to do with its weights changing, and conflating the two causes teams to chase the wrong fix during an incident.
Infrastructure drift covers changes to the hardware generation, numerical precision, or serving framework underneath a model that’s otherwise unchanged. Model or version drift covers an actual change to the model weights, system prompt, or fine-tune. Standard operational metrics miss both categories equally: latency and error rate look the same whether the underlying cause is a GPU swap or a silent model update.
DriftBench (MLSys 2026) found a useful dichotomy between these categories. Hardware and numerical precision changes tend to produce systematic, predictable drift, meaning you can often anticipate the direction and magnitude of a shift before deploying. Framework and model changes are idiosyncratic by comparison, producing drift patterns that vary case by case and resist prediction, including high flip rates on safety-sensitive prompts for some model upgrades. The operational implication is to treat these two change classes differently.
Practical controls that follow from this:
-
Canary suites: route a small percentage of production traffic through a new framework or model version and compare fingerprint distance and flip rate against the incumbent before a full rollout.
-
Workload-specific drift budgets: set a tolerance threshold for acceptable drift per workload type, since a customer-facing chat feature and an internal summarisation tool don’t need the same bar.
-
Measure-before-deploy for framework and model changes: given their idiosyncratic drift pattern, DriftBench’s finding argues for empirical validation ahead of every framework or model change, not just major version bumps.
-
Predictive sampling for hardware and precision changes: since these tend to be systematic, a smaller validation sample can be sufficient once you’ve characterised the pattern once.
Turning signals into alerts, TEVV and incident response
Collecting signals is only useful if they trigger action before a problem reaches users, and that means building an alerting and documentation discipline around the metrics you’ve instrumented.
-
Set thresholds with contextual metadata attached, not just a bare number: an alert that fires on flip rate should carry the probe domain, the model version, and the time window so the on-call engineer isn’t starting from zero.
-
Preserve TEVV (test, evaluation, verification and validation) artefacts over time, a practice the NIST AI Risk Management Framework recommends specifically so that guardrails can be checked against their original justification rather than re-derived from memory during an incident.
-
Use independent reviewers for periodic reassessment where the stakes justify it, since the NIST AI RMF notes that continuous measurement of trustworthy characteristics benefits from assessment that isn’t solely self-reported by the team that built the system.
-
Define rollback criteria in advance, tied to specific thresholds (flip rate above a set bound, fingerprint distance beyond a set percentile) rather than a judgement call made under pressure.
-
Run an after-action review following every triggered rollback, feeding findings back into the TEVV documentation so the next incident starts from a better baseline.
The NIST AI RMF’s after-action review guidance is worth taking literally: a documented review that updates your TEVV artefacts closes the loop between an incident and the next deployment’s guardrails, rather than leaving the lesson in someone’s memory until it’s forgotten.
Building the monitoring pipeline: ingest, evaluate, feedback
A production LLM monitoring pipeline has four components, and each one needs a clear owner or it quietly degrades.
Tracing captures the raw signal: every GenAI span, tagged per the OpenTelemetry conventions, flowing into a storage layer that can handle the volume without becoming the bottleneck itself. Storage needs a retention policy from day one, since prompt and completion content accumulates fast and most of it is never queried again. Evaluation is the layer that turns raw traces into the metrics covered earlier: fingerprint distance, flip rate, hallucination scores, computed on a schedule against sampled traffic. Dashboards and feedback close the loop, routing evaluation results not just to an on-call dashboard but back to the teams who write prompts and fine-tune models, so a detected regression actually changes what ships next.
Synthetic probes deserve their own design decision: cadence (hourly for high-stakes domains, daily for lower-risk ones), sample size (large enough to catch a meaningful shift, small enough to stay affordable), and a hard budget cap so probe spend doesn’t silently grow alongside production traffic.
Data governance has to be built in, not added later:
-
Redaction: strip personally identifiable information from captured prompts and completions before they reach long-term storage.
-
Role-based access control: restrict who can query raw trace content versus aggregated metrics.
-
Retention limits: set an explicit expiry for raw content, distinct from the longer retention you’ll likely want for aggregated metrics.
How Vector Studios applies these monitoring patterns
Vector Studios builds multi-agent systems through JARVIS, a proprietary orchestration platform that coordinates multiple AI agents across both client projects and game development work. Running agents in orchestration daily means behavioural drift is a practical concern: a silent change in one agent’s output can cascade into every downstream agent it feeds, which is the failure mode that per-agent fingerprinting and traced span hierarchies are designed to catch.
The patterns in this guide reflect what we apply directly:
-
Per-agent telemetry using OpenTelemetry GenAI span conventions, so a multi-hop agent chain stays traceable end to end rather than collapsing into a single opaque call.
-
Canary rollouts for any model or framework change before it reaches a full agent pipeline.
-
TEVV artefact preservation across engagements, so a client’s evaluation history survives a team handover or a model upgrade.
These same practices are applied in client engagements building custom multi-agent systems, rather than being an internal-only standard.
Fitting LLM monitoring into existing ML Ops and DevOps workflows
LLM monitoring doesn’t need a parallel stack: it needs to plug into the CI/CD, alerting and incident tooling your team already runs. The cleanest integration point is your existing tracing backend. If it already ingests OpenTelemetry spans from other services, GenAI spans following the same conventions slot in without a separate pipeline, which is one of the stronger practical arguments for adopting the standard rather than a bespoke schema.
Alerting should route through the same on-call system your SRE team already uses, with GenAI-specific alerts (flip rate, fingerprint distance) sitting alongside existing latency and error-rate alerts rather than in a separate dashboard nobody checks during an incident. CI/CD is the other natural integration point: a canary suite comparing fingerprint distance against a baseline fits naturally as a pre-deploy gate, the same way a performance regression test gates a standard service deploy.
The friction usually shows up in ownership, not tooling. Behavioural metrics like flip rate and hallucination score don’t map cleanly onto either the ML team or the platform team’s usual remit, and leaving that ambiguous is how a detected drift event sits unactioned for days. Assign an explicit owner for behavioural alerts before you need one, and treat TEVV documentation as a shared artefact between the ML and platform sides rather than either team’s sole responsibility.
Where LLM monitoring has mattered in production
The clearest real-world pattern across LLM-serving teams is the gap between a metrics dashboard looking healthy and an endpoint behaving differently. A silent provider-side model update is the recurring culprit: latency and error rate stay flat while a fixed probe set, run against the same endpoint before and after, shows a measurable shift in response category, which is precisely the scenario fingerprinting is designed to catch. DriftBench’s finding that framework and model changes produce idiosyncratic, hard-to-predict drift, including elevated flip rates on safety-sensitive prompts for some upgrades, matches this pattern: the change itself was routine from the provider’s side, but its effect on behaviour was not.
Multi-agent systems surface a second recurring case. When one agent’s output feeds another, a small quality regression in an upstream agent doesn’t show up as an error, it shows up as a gradual quality decline several hops downstream, which is far harder to trace without per-agent span hierarchies showing exactly which link in the chain changed. Teams running agent orchestration at any scale tend to find that the debugging question isn’t “did an error occur” but “which agent’s output changed first”, and that question is only answerable with traced, timestamped spans per agent rather than an aggregate system-level metric.
Why model updates and retraining change your monitoring baseline
Every model update, whether a provider-side version bump or an internal retrain, invalidates part of your existing baseline, and treating it as a routine deploy rather than a baseline reset is a common source of missed regressions.
Fingerprint baselines need to be recomputed after a confirmed model change, since the old baseline reflects behaviour that no longer exists and will show permanent “drift” against a model that is simply different now, not degraded. Flip rate similarly resets: a probe set’s pass/fail baseline established against the previous model version isn’t a fair comparison point for the new one until you’ve re-run it and confirmed the new baseline.
Retraining and fine-tuning carry an extra risk that provider-side updates don’t: because the change is intentional and internal, it’s tempting to skip the canary step entirely on the assumption that your own team knows what changed. DriftBench’s finding that model changes produce idiosyncratic drift applies just as much to an internal fine-tune as to a third-party provider’s update, which argues for the same measure-before-deploy discipline regardless of who made the change.
The practical rule: any confirmed model change, whatever its source, triggers a fingerprint and flip-rate baseline reset plus a canary comparison before full traffic cutover, not an assumption that prior evaluation results still hold.
Security and privacy considerations when monitoring LLM outputs
Monitoring infrastructure itself becomes a data handling concern the moment it captures prompt or completion content, since that content routinely contains customer data, credentials, or other sensitive material the original application never intended to persist into a trace store.
The OpenTelemetry GenAI conventions address this directly by recommending that full input and output content capture be opt-in rather than default, with large content stored externally and referenced from the span rather than inlined. That pattern does double duty: it keeps trace storage lean, and it lets you apply access controls to the content store independently from the trace metadata store, so an engineer debugging latency doesn’t automatically get read access to raw user prompts.
Role-based access control matters specifically for behavioural monitoring data, since a fingerprint probe set and its historical results can reveal what your safety guardrails are tuned to catch, which is itself sensitive if it leaks to someone probing the system for weaknesses. Retention policy is the other lever: aggregated metrics (flip rate, fingerprint distance over time) can reasonably be kept long-term, while raw prompt and completion content should have a defined, shorter expiry enforced automatically rather than left to manual cleanup.
Tools and platforms for LLM monitoring
Most teams building LLM monitoring today combine three categories of tooling rather than buying one platform that covers everything. A tracing backend that already ingests OpenTelemetry data, extended with GenAI semantic convention support, handles the operational telemetry layer. A separate evaluation layer, whether a managed LLM evaluation product or an internally built scoring pipeline, runs the fingerprinting, flip-rate and hallucination-scoring logic described earlier on a schedule against sampled traffic. A governance layer, often the same access-control and retention tooling already protecting other sensitive data in the organisation, enforces redaction and RBAC on captured content.
The vendor landscape here is still consolidating, and the practical advice is to prioritise OpenTelemetry GenAI convention support when evaluating any tracing tool, since that compatibility is what keeps your instrumentation portable if you switch evaluation or dashboard tooling later. A platform that locks your spans into a proprietary schema costs you that portability the next time your stack changes.
Where LLM monitoring is heading and what to budget for next
Continuous TEVV is moving from a periodic manual exercise towards something closer to automated, ongoing evaluation, run on the same cadence as your deployment pipeline rather than quarterly. Drift prediction is following the same path DriftBench points towards: treating infrastructure drift as something you can model in advance rather than discover after the fact.
The industry is also converging on vendor-neutral telemetry. OpenTelemetry’s GenAI conventions are still maturing, but betting on them now avoids a costly rewrite later. The highest-leverage investment for most teams isn’t a new tool, it’s telemetry hygiene and a well-curated golden dataset for your fingerprint probes, since every detection method above depends on having a trustworthy baseline to compare against.
Getting help building this into your own systems
Vector Studios works with teams building custom multi-agent systems, LLM workflows and generative AI products, and monitoring is part of that build, not an afterthought added once something breaks. Our AI Strategy & Consulting service covers an initial audit of what you’re already instrumenting and where the gaps sit, typically followed by a pilot that puts fingerprinting, tracing and TEVV documentation in place around one high-value workflow before a wider rollout.

Custom Model Development and AI Integration & Automation extend that work into the orchestration layer itself, drawing on the same JARVIS-based patterns we run internally. Ongoing AI Support keeps the monitoring stack maintained as models and frameworks change under you.
Get in touch through the Vector Studios site to scope an audit or pilot engagement.
Sources
-
DriftBench: Measuring and Predicting Infrastructure Drift in LLM Serving Systems (MLSys 2026)
-
Behavioral Drift Detection in Large Language Models via KA-LLM (Zenodo)
-
Stability Monitor / Stability Arena (behavioural fingerprinting paper)
FAQ
Instrument operational metrics (latency, error rate, token usage) with OpenTelemetry GenAI spans, then layer behavioural monitoring (fingerprinting, flip rate) on top using a fixed probe set run on a schedule. Alert on both tiers with contextual metadata attached, and preserve evaluation records so you can check guardrails against their original justification during an incident.
LLM tracking generally refers to recording each inference call as a trace, span by span, including model version, token counts and latency, following a shared schema such as the OpenTelemetry GenAI conventions. That trace data feeds dashboards for operational health and, when paired with fingerprinting, surfaces behavioural changes that latency and error-rate metrics alone miss.
LLM security testing covers probing a model’s outputs for unsafe, leaked or manipulated content, often using the same fixed-probe approach used for behavioural fingerprinting but scored against safety criteria rather than general stability. It overlaps with drift detection methods like those in the Stability Monitor paper, since a security-relevant behavioural shift shows up as a flip-rate change on safety-tagged prompts.
LLM visibility, in practical terms, means having traced spans across every inference and tool call plus behavioural metrics like fingerprint distance and flip rate layered on top of standard latency and error-rate dashboards. Adopting a shared tracing schema such as OpenTelemetry’s GenAI conventions is what makes that visibility queryable across different model providers rather than siloed per vendor.